Christopher Burgess
Burgess Analytical Consultancy Limited, “Rose Rae”, The Lendings, Startforth, Barnard Castle, Co. Durham, DL 12 9AB, UK
John Hammond
Starna Scientific Ltd, 52–54 Fowler Road, Hainault Business Park, Hainault, Essex, IG6 3UT, UK/p>
Introduction
Following on from our overview “Standards for the 21st century–establishing trust in measurement” this article discusses the changes that have occurred within one of the oldest instrumental spectroscopic techniques, namely UV-visible spectrometry. Many of these changes have been as the result of demand in specific areas, and a requirement to find solutions to defined problems. For these reasons, there has been a move away from traditional optical bench type instruments with an increased use of dedicated analysers in non-laboratory environments. Many of these devices are based on solid-state array technology with an increasing use of MEMS (microelectromechanical systems) micro-machining techniques1 to produce miniature spectrometers. The use of such devices in un-skilled hands may take the application use outside the “control envelope” validated in the units’ design. In this situation, the instrument may fail to respond in a proper manner, or more seriously still produce a result that is totally meaningless. We discuss some of the limitations and issues with miniature spectrometers in the section on Instrument design.
In the area of instrument qualification, we will look briefly at three aspects which continue to cause problems, namely wavelength calibration, absorbance/transmittance accuracy and stray light measurements.
Instrument design
It has been our experience that it is becoming common practice when specifying a diode array spectrometer, that the diode spacing of an array is taken as the spectral bandwidth achieved by the instrument. This is a dangerous assumption, as in practice the spectral bandwidth approximates to twice the diode spacing owing to shadowing.
It is important to remember that in order to achieve 99% of the “true” absorbance of a spectral band, then the ratio of the natural half bandwidth of the chromophore to the spectral band width (SBW) of the spectrometer should be more than eight.2 Hence, when measuring materials with sharp bands, e.g. benzenoid compounds, the SBW is very important and probably renders many miniature spectrometers unsuitable for such types of measurement.
The ready availability of fibre-optic based modular devices allows the user to build systems for a specific purpose, and it is often assumed that these array-based fibre optic systems are immune to room light interference at the sample interface, which may or may not be true. This assumption is easily tested by using a black photographic “film changing bag” or a simple black cloth. Use of this masking technique shouldn’t change the measured value if the assumption is true.
One obvious benefit of array-based spectrometers is that they have no moving parts to wear out, and are therefore perceived to be more reliable. This is true, but the reverse-optics optical design means that both the sample and optics prior to the dispersing element (usually a grating) are still subjected to the full spectrum radiation also encountered by these components in a conventional spectrometer. In a conventional spectrometer, these components are outside the monochromator and optical beam deflection and/or scattering simply reduces the light intensity entering the monochromator. In an array-based spectrometer, deflection occurs within the monochromator causing scatter within the confined environment. Compare the explosive effect of gunpowder in an open and confined environment, and the relative impact of these situations.
Another downside of these modular-based systems is the lack of interlocks between the source and detector modules. Commercial diode-array instruments systems apply shutters to limit the exposure time of the sample by the source during the measurement sequence. In simple “self-built” systems the source may be simply coupled by fibre directly to the sample interface, with the only control the source ON/OFF switch. We recently obtained a cuvette with a circular beam image “burnt” on to the optical face of the cuvette using such a fibre-optic based array system. As can be seen in Figure 1, this damage is centred at exactly 15 mm above the base, a common measurement “Z” height.
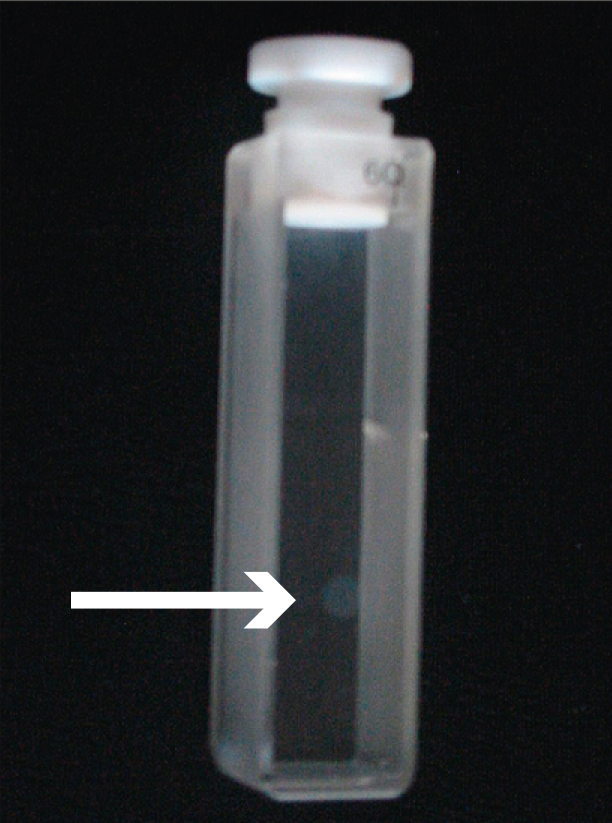
Figure 1. Damaged cuvette.
Instrumental qualification
Wavelength
To provide reference materials for this fundamental parameter, holmium has been the element of choice in both acidic solution and glass melt forms. The earliest standards were the glass melt forms.
There has been much debate that holmium glass peaks vary with different suppliers or melts. Our experience has shown that variation in the base-glass will move the spectral cut-off in the UV region which may or may not allow the resolution of the UV peaks below 300 nm with the 241 nm band being a particular problem as it lies on the sharp cut off edge of the filter. A typical spectrum is shown in Figure 2 and the difficulties below 300 nm are clearly shown. The problem is exacerbated by varying thicknesses of the glass. However, the main problem with holmium glass is the hygroscopic nature of the material, which causes a “bloom” on the glass surface with time. Careful cleaning of the filter can restore the clear optically polished surface. For these reasons, holmium glass melts should be individually certified, and returned for period cleaning and re-certification to maintain traceability.
In recent years a comparative study by NIST and many other NMI’s has led to the definition of a set of “intrinsic standard” values for a 4% solution of holmium oxide in 10% m/v perchloric acid.3 A spectrum of NIST SRM 2034 is shown in Figure 3. In the case of the liquid reference the characterisation of peaks below 300 nm is no longer a problem. The statement is essentially true, however, as in the case of the holmium glass, it is the spectral characteristics in the low UV region that are sensitive to the matrix. In this case the purity of the holmium oxide material must be >99.99%, and considerable spectral change is observed between purity values of 99.99% and 99.999%.
In order to address the requirement for wavelength references below 240 nm the same chemical structure which gives holmium its characteristic spectrum can be used to good effect with other rare earth elements to provide spectral features in the 200–300 nm region.
Transmittance/absorbance
Much has been written about the preparation, use and stability of acidic potassium dichromate solutions. The key factor relating to these systems is the choice of the acid matrix used. In sulphuric acid inorganic polymerisation will occur with time resulting in a decrease in the measured absorbance. In perchloric acid, however, no such complex formation occurs, and once equilibrium between the chromate and dichromate ions is established, a stable reference can be produced.
It is often stated that metal-on-quartz filters can provide a viable alternative UV transmittance filter to dichromate solutions. Produced in recent years by both NMI’s and commercial organisations those filters have always suffered from the reactive nature of the coated surface to absorb contamination and thereby degrade, “pinhole” etc. This problem has been solved to a large extent by optically bonding a quartz cover-plate to the coated surface, however, a fundamental physical problem remains. These “transmittance” filters work by reflection, reflecting back down the optical path the unwanted spectral component. If one considers a 2 A (1% T) filter—99% of the incident beam is being reflected directly back into the spectrometer, and may seriously affect the measurement process. You are measuring a mirror! NIST make direct mention to this effect when referring to SRM 2031a. Unless the optics are blazed you will get a reflection off the detector back through the optical train to the source which will cause abnormally low absorbance readings. You can check this effect by measuring your filter at a slight angle (preferably 2°) to the incident beam. If you observe a significant increase then you have an inter-reflection error.
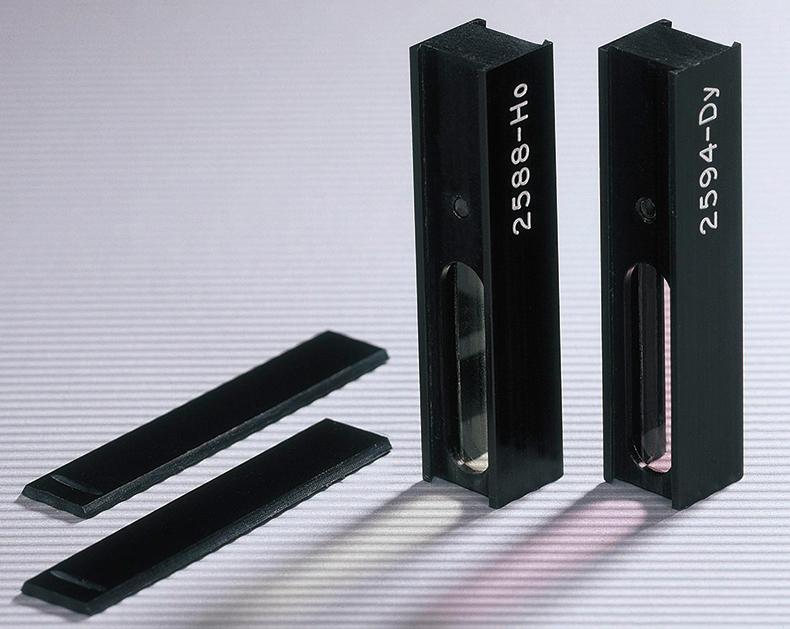
Holmium glass
Equally stable with a proven “track record”, glass filters based on Schott NG series glasses for use in verification of the visible (440–635 nm) region have been available for nearly 40 years. However, experience has shown that these filters can be as sensitive to cleaning as any metal-coated filter and the use of liquids should be avoided at all costs. For this reason they should not be cleaned other than by use of a clean air or fine hair brush and re-certified at intervals to maintain traceability.
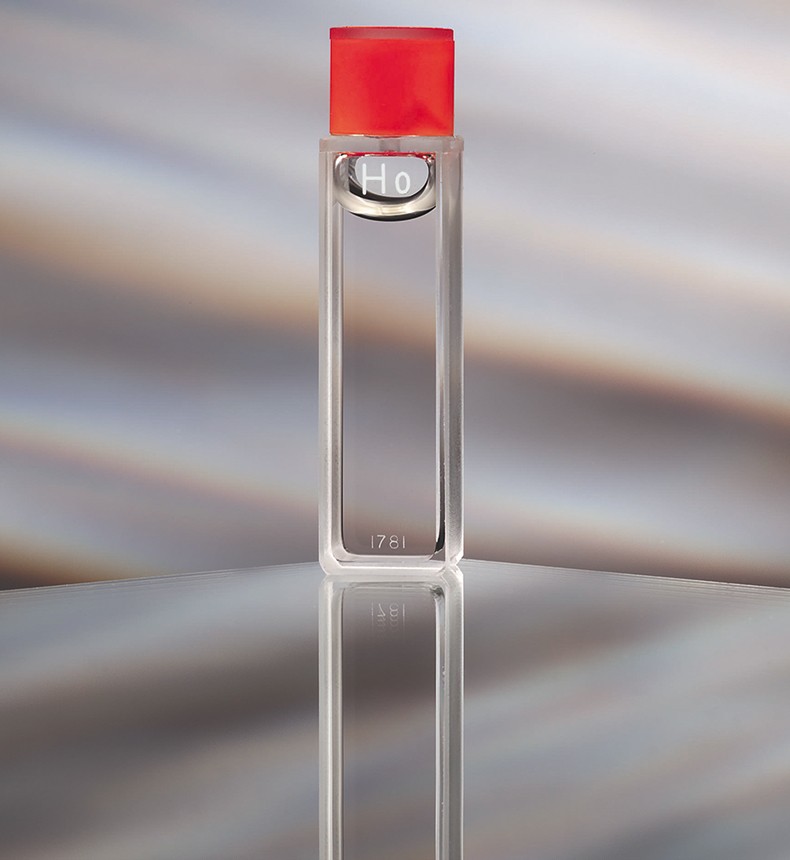
Holmium liquid
Estimation of stray radiant power ratio (stray light)
Of all the fundamental parameters that require verified in the qualification of a UV-visible spectrophotometer based system, personal experience has shown that “stray-light” has the most definitions, variability in the terminology used and ultimately lack of understanding in the environment in which the instrumentation is used. At its extreme it has been assumed that the spectrometer’s published stray light limit specification defines the absorbance range over which the instrument can be used. This is a dangerous assumption for any user to make. It’s even worse if used by the manufacturer. In simple terms, deviation from linearity will occur at some point well before the limiting absorbance is reached. A more complete discussion of the principles, theory and application has been published.4 The only way to be sure of the actual operational range of your spectrometer is to measure it under your experimental conditions. The use of the VFG approach is highly recommended5 although it is not often used nowadays.
References
- http://www.memsnet.org/mems/what-is.html
- P. Torkington, Appl. Spectrosc. 34, 189 (1980). https://doi.org/10.1366/0003702804730556
- J. Travis et al., J. Phys. Chem. Ref. Data 34(1), 41–56 (2005). https://doi.org/10.1063/1.1835331
- C. Burgess, Encyclopedia of Analytical Science. Elsevier, pp. 3643–3647 (2003).
- J.M. Vandenbelt, J. Forsyth and A. Garrett, Anal. Chem. 17, 235 (1945).


