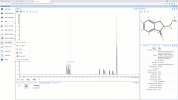
Sensologic have introduced version 2.0 of their SL Data Manager software for spectroscopy. Several new functions have been introduced which will be helpful in management, visualisation and handling of data for quantitative and qualitative modelling with the SL Calibration Wizard and the soon-to-be-released SL Classification Wizard.
The new features include:
- Advanced graphics options, e.g. for improved visual evaluation of spectra series or libraries—including direct application of transformations—and for graphical spectra selection. Also available is the ability to view all spectra assigned to a sample in a sample spectra graph, or display a selected single spectrum.
- Easy removal of database entries which are no longer in use, e.g. applications, methods, models, samples or series etc.
- Simple preparation of transformation batches, using additional transformation algorithms, e.g. Savitzky–Golay, Multiplicative Scatter Correction or Kubelka–Munk. New transformations can be applied immediately to series and library graphics.
- Helpful additional information in the info pane, e.g. for series, the available properties are shown, including the number of assigned samples and a property value histogram; for calibration models, the used series and wavelength range are shown.
- Extended data management of libraries (Create, Edit, Copy, Delete) for development of qualitative models with the new SL Classification Wizard.
- Improved usability, for example by easy availability of model reports, a new “Save as” function for duplicating models or methods, and simple access to the validation status of methods.


