David Perez-Guaita,a Kamila Kochan,a Anja Rüther,a Phillip Heraud,a,b Guillermo Quintasc and Bayden Wooda
aCentre for Biospectroscopy, Monash University, Australia. E-mail: david.perez.guaita@monash.edu
bDepartment of Microbiology and the Biomedical Discovery Institute, Monash University, Australia
cLeitat Technological Center, Valencia, Spain
Research groups around the world are studying the spatial location and distribution of molecules within cells using an increasing number of analytical techniques such as infrared (IR), Raman and X-ray fluorescence (XRF) spectroscopy. The information obtained from these techniques in terms of lipids, proteins and the general metabolome is complementary, but commonly the analysis of the data is performed individually on each technique. These three techniques are based on different interactions of the sample with light with different energy and wavelengths, leading to dissimilarities in the spectral features offered by each technique. Table 1 summarises the main features of Raman and IR microspectroscopy, both representing vibrational spectroscopic methods. Raman spectroscopy is a scattering technique, in which energy is transmitted from a photon to a molecule, resulting in a shift in the wavelength of the incident light beam. Fourier transform (FT)-IR spectroscopy, on the other hand, is an absorbance technique where the molecule absorbs a photon and gains energy moving from a lower to a higher vibrational energy state. These methods are complementary in terms of providing molecular information on samples, as molecules or functional groups that tend to be strong Raman scatters are usually weak IR absorbers and vice versa. The techniques also complement each other in terms of their advantages and disadvantages for the investigation of biological systems. FT-IR spectroscopy is a non-destructive method with a good signal-to-noise (S/N) ratio and a high efficiency. Raman may lead to a thermal destruction of a cell or tissue due to the high output power of the light source and has a considerably lower S/N ratio, unless the energy of the incident light is close to an electronic transition of the analyte. In that case, resonance Raman enhances the S/N by several orders of magnitude. Surface enhanced Raman spectroscopy (SERS) can also be used for increasing the S/N ratio of Raman spectroscopy. However, as the light source in Raman is a typically a laser with wavelength ranging from the ultraviolet to near IR (240–1064 nm), the achievable spatial resolution is higher depending on the wavelength of the incident photons. Furthermore, as water is a weak Raman scatterer, cells and tissues can be studied using Raman spectroscopy under physiological conditions.
Table 1. Comparison of Raman and IR spectroscopy imaging techniques.
Feature | Raman | Infrared |
Origin | Scattering of light: molecular vibrations with changes in the polarisability tensor of a functional group or a molecule | Absorbance of light: molecular vibrations with changes in the dipole moment |
Information | Symmetric molecules | Asymmetric molecules or fucntional groups |
Efficiency | Low | High |
S/N ratio | Low (unless resonance or SERS is used) | High |
Spatial resolution | ~0.2–0.7 µm (wavelength-dependent on the incident radiation) | 2–10 µm (wavelength-dependent) |
Living cells | Good applicability (water is a weak Raman scatterer) | Possible (strong background contributions from water) |
Destructiveness | Thermal- and photo-denaturation possible | Non-destructive |
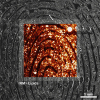
While IR and Raman are very useful in establishing the chemical functional groups of a sample, XRF enables compositional elemental analysis. XRF spectra are obtained by irradiating a sample with X-rays and recording the emitted fluorescence.1 The complementarity of the information obtained from the three techniques makes their combination extremely powerful in understanding both the molecular and atomic compositions. Biological samples, such as cells or tissues, are complex entities composed of a wide range of chemical compounds including organic and inorganic molecules as well as monoatomic ions. Changes due to an external factor (e.g. inoculation of a drug, radiation or infection by a pathogen) affect the complex network of interactions between the metabolome, proteome and metallome. However, with a single technique only a portion of the molecular phenotype can be studied, thereby neglecting the contributions of the non-detectable analytes, which remain as “dark spots in the whole picture”. The biochemical interpretation of these changes is challenging if only individual sections of a phenotype provided by one instrument are analysed and studied independently. The integration of different modalities will enable a holistic comprehension of the biological system under study obtaining correlation between IR (polar/asymmetric molecules), Raman (chromophoric/symmetric molecules) and XRF (elementary composition). In addition, the use of hyperspectral images from different modalities enables spatial correlations based on molecular composition within cells and tissues. Figure 1 depicts the conceptual framework of a multimodal Raman and FT-IR hyperspectral image using a giant algal cell from the genus Mictrasteria as the model. In short, a cell or tissue is measured using FT-IR and then Raman with a similar spatial resolution per pixel. Alternatively, if the initial images contain different pixel sizes, pixels can be binned to match the lowest pixel resolution. In our case, IR images were registered to match the Raman image by rotating and/or cropping the image. Image processing registration algorithms such as the ones available in the Image Processing ToolboxTM from Matlab (Mathworks) are very useful in this process. After registration, an augmented data matrix (X, Y, VIR + VRS) is obtained, with X and Y being the size of the image, and VIR and VRS the number of variables in the IR and Raman images, respectively. Then, the image can be treated in a similar way to a standard dataset by reshaping the 3D image into a 2D matrix (X × Y, VIR + VRS). In a previous study, we pioneered the use of multimodal vibrational (IR and Raman) imaging for the complete study of cells.2 In this article, we highlight the challenges and advantages on analysing cells through multimodal imaging of cells and we provide two examples performed with algae.
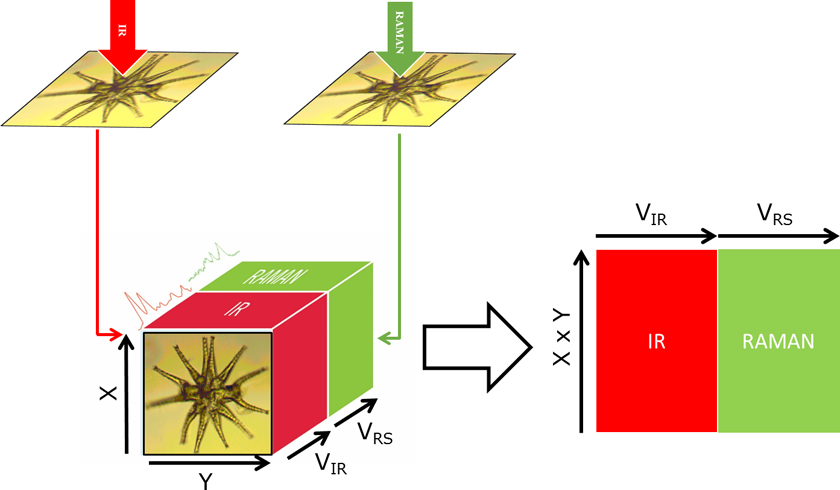
Figure 1. Conceptual scheme of the multimodal imaging of a Micrasterias algae, depicting the registration of IR and Raman hyperspectral images for creating an extended data matrix.
Data analysis and technical challenges
Two main challenges have to be considered for the creation and analysis of multimodal images. First, there are technical impediments on acquiring the images using different modes. Creating a hyperspectral multimodal image containing unique IR, Raman and/or XRF spectra requires i) exactly the same area of the sample to be measured with the different techniques and ii) the use of the same pixel size, overcoming the dissimilarities in special resolution by binning pixels or over- or under-sampling. The selection of substrates that enable the measurement of images through several platforms is a crucial aspect for obtaining successful results. Substrates should be compatible with the different techniques and not present any strong signals, which discards the use of low emissivity slides substrates and regular CaF2 windows for Raman. Alternatively, silicon wafers and Raman grade CaF2 windows are suitable substrates for performing Raman, reflection IR and transmission IR measurements, respectively. In addition, it is important to consider a sequence of operations that will ensure that the non-destructive techniques are performed first (e.g. perform FT-IR first). Another pitfall is finding the same cell or tissue section of interest under the microscope, which can be also troublesome under high magnification, and requires the use of flags such as marker points to locate the exact region. The same flags can be used for ensuring that cells are measured in the same spatial orientation, which facilitates the process of registering the images.
The second challenge to overcome is to data mine the combined images to extract meaningful biological information. The lack of analytical data tools for integrating information obtained from different platforms makes the comprehension of complex biological systems a challenge. To analyse single hyperspectral images is a complex issue per se, but when different modalities are integrated, the analysis should additionally deal with correlations between the variables from the different spectra. Advances in multimodal chemical imaging technologies and hyphenated analytical systems require new multivariate approaches to extract meaningful data and determine correlations in complex biological systems. Data fusion can be defined as the process of integrating data obtained from different sources. Data acquired from complementary sources can be jointly analysed for studying the relationship between variables obtained from different modalities. This enables a comprehensive understanding of the system, which can lead to an improved molecular phenotyping.3 Literature shows recent attempts at integrating data provided by different platforms: i) Statistical heterospectroscopy is used for the co-analysis of spectral datasets obtained from different spectroscopic platforms with multiple samples. The methodology performs a covariance map between the spectral dataset measured by the different techniques. This approach has already been employed for the correlation of NMR and IR spectra4 and NMR and CE spectra. ii) Orthogonal partial least squares (O-PLS and O2-PLS) was used in the field of metabolomics and proteomics to integrate for example data from NMR and MS analytical platforms. iii) Joint and Individual Variation Explained (JIVE) is a method that separates the shared patterns among data sources (i.e. the joint structure) from the individual structure of each data source that is unrelated to the joint structure.5
Principal component analysis (PCA) of a hyperspectral image of a whole algae
Figure 2 depicts the PCA of a hyperspectral multimodal image combining IR and Raman spectroscopies. The dataset was created using the procedure explained in Figure 1. Raman and IR hyperspectral images were registered and a PCA was performed over the extended dataset using second derivative and mean centring as the pre-processing steps. Prior to the data fusion, the spectra of the two images were normalised independently using standard normal variate normalisation to eliminate dissimilarities between the ranges of Raman intensity (1–1000 counts) and IR absorbance (0–1 AU) values. Figure 2a shows a 3D image corresponding to the PC1 scores values for each pixel in the hyperspectral multimodal image. It can be seen that PC1 values are not distributed homogeneously along the cell; the centre and arms of the cell show low values whilst the edges of the cell show high values. This distribution evidences that the PC1 captures variability related to differences between the spectra of the cellular wall and the rest of the cell. To gain insight into the changes in the spectra, which are caused by differences of the chemical composition of the cell, the loading vector of PC1 is investigated (see Figure 2a and b). The PCA was performed over the second derivative of the data, so the loading was integrated twice for a better interpretation. It can be seen that some bands are strongly correlated (range 1540–1142 cm–1) for both modalities, which indicates that they correspond to molecules that show absorbance in both Raman and IR. Other bands such as the ones assigned to C=O (1750 cm–1), and Amide I (1650 cm–1) show a strong negative value in the IR spectra, whilst the band assigned to Amide II (1540 cm–1) shows a small negative value in Raman and IR. This indicates that the proteins are concentrated in the regions with a negative value of the PC1 score, i.e. in the centre of the cell, and the edge of the cell is lower in proteins. Interestingly, the region between 1200 cm–1 and 900 cm–1 presents a derivative shape, being highly positive between 1100 cm–1 and 900 cm–1 and negative between 1200 cm–1 and 1100 cm–1. In this region, several bands including the ones associated with C–O and P–O stretching modes are present, making it difficult to assign them to lipids, phospholipids or carbohydrates. The composition of the edge of the cell, which shows positive PC1 values is related to the positive contribution of the 1100–900 cm–1 band, but the position of the band does not give enough information by itself to elucidate its origin. At this point, the multimodal approach can contribute to solve the vague assignment of the IR bands. In the 3050–2700 cm–1 region (see Figure 2b), it can be seen that the Raman loadings vector shows a broad negative band in the regions associated with the C–H stretching vibrational mode. The broad Raman band at this position is presumably associated with the presence of lipids, which are highly symmetric molecules with a large Raman cross-section. This indicates that lipids are concentrated inside the cells and not on the edges. The fact that the Raman band at 2916 cm–1 is inversely correlated to the IR band at 1100–900 cm–1 eliminates the possible assignment of this band to lipids. That indicates that the IR bands located at 1100–900 cm–1 are caused by a high concentration of carbohydrates.
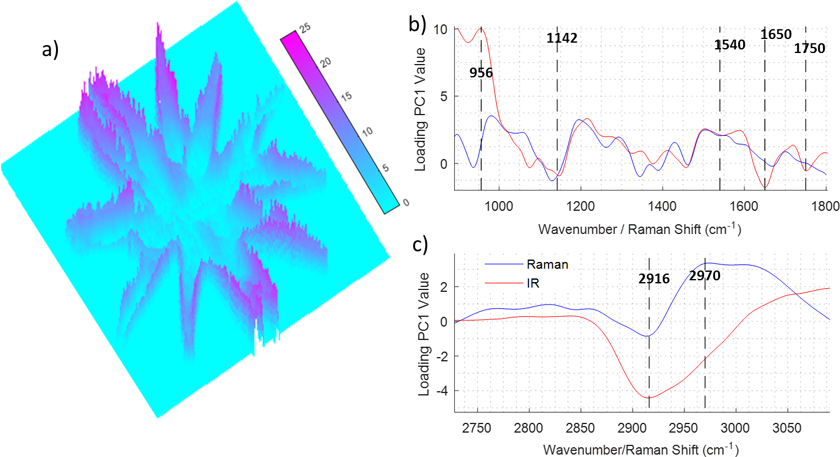
Figure 2. Example of data treatment for the data fusion of infrared and Raman imaging measurements of an algae. a) PseudoColor image representing the first score. b) and c) Loading values of the first score for the 900–1800 cm–1 and 2700–3050 cm–1 regions.
In summary, the use of multimodal imaging can be technically challenging and requires the use of complex data analysis procedures for resolving the sophisticated relationships between the different variables. However, it provides a comprehensive picture of the biological system under study.
References
- N.J. de Winter and P. Claeys, “Micro X-ray fluorescence (µXRF) line scanning on Cretaceous rudist bivalves: a new method for reproducible trace element profiles in bivalve calcite”, Sedimentology 64, 231–251 (2017). doi: https://doi.org/10.1111/sed.12299
- D. Perez-Guaita, K. Kochan, M. Martin, D.W. Andrew, P. Heraud, J.S. Richards and B.R. Wood, “Multimodal vibrational imaging of cells”, Vib. Spectrosc. 91, 46–58 (2017). doi: https://doi.org/10.1016/j.vibspec.2016.07.017
- E. Acar, A.J. Lawaetz, M.A. Rasmussen and R. Bro, “Structure-revealing data fusion model with applications in metabolomics”, in Conf. Proc. Annu. Int. Conf. IEEE Eng. Med. Biol. Soc. 2013, 6023–6026 (2013). doi: https://doi.org/10.1109/EMBC.2013.6610925
- D.J. Crockford, E. Holmes, J.C. Lindon, R.S. Plumb, S. Zirah, S.J. Bruce, P. Rainville, C.L. Stumpf and J.K. Nicholson, “Statistical heterospectroscopy, an approach to the integrated analysis of NMR and UPLC-MS data sets: application in metabonomic toxicology studies”, Anal. Chem. 78, 363–371 (2006). doi: https://doi.org/10.1021/ac051444m
- J. Kuligowski, D. Pérez-Guaita, Á. Sánchez-Illana, Z. León-González, M. de la Guardia, M. Vento, E.F. Lock and G. Quintás, “Analysis of multi-source metabolomic data using joint and individual variation explained (JIVE)”, Analyst 140, 4521–4529 (2015). doi: https://doi.org/10.1039/C5AN00706B


