Mark E. Hodson,a Liane G. Benning,b,c Gianfelice Cinque,d Bea Demarchi,e Mark Frogley,d Kirsty E.H. Penkman,e Juan D. Rodriguez-Blanco,b,f Paul F. Schofield,g Emma A.A. Versteeghh and Katia Wehbed
aEnvironment Department, University of York, YO10 5DD York, UK. E-mail: mark.hodson@york.ac.uk
bCohen Laboratories, School of Earth and Environment, University of Leeds, LS2 9JT Leeds, UK
cGFZ German Research Centre for Geosciences, Helmholtz Centre Potsdam, Telegrafenberg, 14473 Potsdam, Germany
dBeamline B22, Diamond Light Source, Diamond House, Harwell Science and Innovation Campus, Didcot, Oxfordshire, OX11 0DE, UK
eBioArCh, Departments of Chemistry and Archaeology, University of York, York, UK
fNano-Science Center, Department of Chemistry, University of Copenhagen, 2100 Copenhagen, Denmark
gMineral and Planetary Sciences, Department of Earth Sciences, Natural History Museum, London SW7 5BD, UK
hSoil Research Centre, Department of Geography and Environmental Science, School of Archaeology, Geography and Environmental Science, University of Reading, Wokingham RG6 6DW, UK
Introduction: earthworms and calcium carbonate
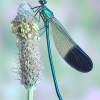
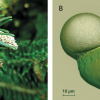
Several species of earthworm, including Lumbricus terrestris, often called the lob worm or night crawler, secrete millimetre-scale granules of calcium carbonate (see Figure 1).1 A number of questions are posed by these granules, not least, the function that they serve (we think they are involved in pH regulation). This article addresses questions about the mineralogical composition of the granules. The granules start off life as a milky fluid, actually a suspension of micron-scale amorphous calcium carbonate, in the rear-most of three pairs of pouches that together form the earthworm’s calciferous gland. This gland is located between the 10th and 12th segments of L.terrestris. The milky fluid passes from the rear-most pouch to the foremost and, in the process, the spherulites aggregate together and largely recrystallise to calcite prior to excretion into the earthworm intestine and from there out into the soil.2 The curious thing about the mineralogical composition of the soil-secreted granules is that whilst they are predominantly calcite, a common crystalline form of calcium carbonate, different polymorphs (same chemical composition but the atoms and molecules are arranged differently to give a different mineral form) of calcium carbonate can also be found in the granules—aragonite, vaterite and amorphous calcium carbonate (ACC).2,3 We have detected amorphous calcium carbonate in granules that are several years old, which is rather surprising. If chemists make pure amorphous calcium carbonate in the laboratory using inorganic chemistry, it is extremely unstable, transforming within minutes to the crystalline polymorphs such as calcite. There is experimental evidence that organic molecules can stabilise amorphous calcium carbonate, either by binding to the surface of amorphous calcium carbonate molecular clusters and inhibiting their dissolution and recrystallization, or by binding to Ca2+ ions, inhibiting or retarding their interaction with HCO3– and CO3.2,3,4
In this study we wished to determine whether the ACC in the granules was stabilised by organic molecules. Aside from good old fashioned scientific curiosity there are potential industrial benefits in understanding the stability of the different forms of calcium carbonate as this material is used in a whole host of industries.
Initially we worked on the bulk composition of the granules using Fourier transform infrared (FT-IR) spectroscopy but then we carried out some spatially resolved analyses with synchrotron-based µ-FT-IR mapping at Beamline B22 (Multimode InfraRed Imaging And Microspectroscopy, MIRIAM) of the Diamond Light Source, in the UK.

Figure 1. Granules of calcium carbonate secreted by the earthworm L. terrestris. Top, scale bar 400 µm; middle, scale bar 100 µm; bottom, scale bar 20 µm.
The bulk composition of the granules
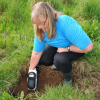
Our first challenge was to collect some granules. We purchased some L. terrestris earthworms from Worms Direct (Drylands, Ulting, Nr Maldon, Essex CM9 6QS, UK). Thanks to fishermen and gardeners there are good commercial supplies of this species of earthworm. We collected soils from a range of different locations around Berkshire, UK, dried the soil and then sieved it to <250 µm. We then moistened the soil and cultivated earthworms in it for 27 days. The earthworms were removed and the soil sieved to <500 µm. This allowed us to collect the granules, that are ca 2 mm in diameter, which had been excreted into the soil. Subsamples of these granules were ground and the powders analysed by FT-IR spectroscopy using an A2-Technology (Danbury, USA) MicroLab portable mid-IR spectrometer fitted with a diamond internal reflection (DATR) capability in order to determine the form of calcium carbonate present and by liquid chromatography for their amino acid content.
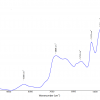
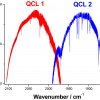
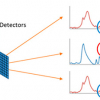
Calcium carbonate is easily identified using FT-IR spectroscopy (see Figure 2). Crystalline carbonate phases such as calcite have distinct bands at ~714 cm–1 (ν4), ~866 cm–1 (ν2), ~1084 cm–1 (ν1) and 1420–1470 cm–1 (ν3) whilst ACC lacks the distinct vibrational band at ~714 cm–1.
The FT-IR spectra of the bulk granules had differing peak area ratios for both the ν2 : ν4 and the ν3 : ν4 bands indicating differing ratios of amorphous calcium carbonate (higher ratio) to crystalline calcium carbonate (lower ratio) in the granules. We could not detect bands in the spectra corresponding to organic molecules present within the granules but this could have been due to low concentrations and detection issues.
The liquid chromatography that we carried out on the granules did indicate the presence of a range of amino acids. These may have been present initially as amino acids or proteins, our extraction method breaks proteins up into their amino acid building blocks. When we compared the amino acid content of the granules to the peak area ratios we saw good correlations between the two for various amino acids such as aspartic acid/asparagine, glutamic acid/glutamine and phenylalanine. Although correlation does not equal causation, this suggests that the proteins or amino acids might be stabilising the amorphous calcium carbonate. To investigate this further we decided to carry out spatial analysis to see whether the organic molecules were associated with the amorphous calcium carbonate or not.
Spatial analysis of the granules
First, we collected some more earthworm granules. We embedded these granules in EpoFIX (Struers) resin blocks and ground away the resin to expose cross sections through the granules. These samples were analysed at beamline B22 of the Diamond Light Source using a Bruker Vertex 80 V FT-IR instrument connected to a Hyperion 3000 microscope to produce µ-FT-IR maps. Spectra were collected in reflectance mode with a liquid N2 cooled Mercury-Cadmium-Telluride (MCT) broadband detector, and at a resolution of 4 cm–1 by co-adding between 128 and 1024 scans per point. Both large (ca 700 μm × 700μm, 20–25 μm aperture, internal globar and synchrotron sources onto a gold mirror and zinc selenide substrate, respectively) and small (ca 100 µm × 150 µm, 6 µm aperture, synchrotron source, gold mirror reference) scale maps were produced of areas of the granule cross sections.
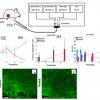
We attempted to map out the distribution of amorphous calcium carbonate in the granules by processing our data in four independent ways using Opus 7.2 (Bruker) software. In the most direct approach we mapped out the intensity of the FT-IR signal between 855 cm–1 and 890 cm–1 (for the n2 peak) and 695 cm–1 and 716 cm–1 (for the ν4 peak) and the ratio of the two. The ν2 : ν4 peak ratio should be highest for regions of ACC. Second, we carried out cluster analysis on the second derivative of the 855–890 cm–1 and 695–716 cm–1 regions of the spectra following vector normalisation. Although this method did not allow us to identify amorphous and crystalline calcium carbonate it identified areas with similar FT-IR spectra. Finally, we used standard amorphous calcium carbonate and calcite spectra (see Figure 2) to carry out component regression on our maps, considering the 650–1200 cm–1 range. The resulting intensity maps show how good a fit there is between the standard spectrum (either ACC or calcite) and the spectrum at each point on the FT-IR spectroscopic map. These four independent methods all identified similar areas as being likely to comprise amorphous calcium carbonate (see Figure 3). There was good correspondence between areas with a high ν2 : ν4 peak ratio and the areas that showed the best match to the standard amorphous calcium carbonate spectrum. Similarly there was good correspondence between the areas with a low ν2 : ν4 peak ratio and the areas that showed the best match to the standard calcite spectrum. Finally, the cluster analysis identified areas with distinct FT-IR spectral characteristics that corresponded to the high and low ν2 :ν4 peak areas.

Figure 2. Typical FT-IR spectra of calcite, a crystalline calcium carbonate, and amorphous calcium carbonate.

Figure 3. Images and intensity maps from synchrotron-based µ-FT-IR mapping of a earthworm-secreted calcium carbonate granule. Scale bar in a) is 200 µm. a) Reflected light image of a cross-section through a granule; b) 855–890 cm–1(ν2), c) 695—716 cm–1 (ν4) and d) ν2 : ν4 ratio intensity maps suggesting the presence of amorphous calcium carbonate in the lower half of the map and calcite in the upper half; e) cluster analysis maps showing areas of distinctly different FT-IR spectra in the upper and lower halves of the map; f) amorphous calcium carbonate and g) calcite component regression intensity maps suggesting amorphous calcium carbonate in the lower half of the maps and calcite in the upper half. For µ-FTIR intensity maps, red indicates high intensity and blue indicates low intensity. This figure is taken from Hodson et al. (2015).5
Having identified ACC we had hoped to identify bands related to organic compounds in our spectra as well to see whether there was any relationship between the two. We did not see a peak at 1650 cm–1 where the amide I band should occur and unfortunately our spectra had a broad peak in the 1570–1350 cm–1 wavenumber range where we had hoped to see distinct peaks at 1540 cm–1 and 1450 cm–1 corresponding to the amide II and lipid/amide III bands, respectively. The ν3 peak of calcite is also present in this range (at 1420–1470 cm–1). To date we have been unable to deconvolute this mixed component peak. We are now attempting to use another spectroscopic technique—scanning transmission X-ray microscopy—at the Diamond Light Source (Beamline I08), to do the same job using Ca X-ray absorption near edge spectroscopy (XANES) maps to identify the form of calcium carbonate present and C XANES to determine whether any of the carbon present in amorphous calcium carbonate regions is present as organic carbon rather than carbonate.
Acknowledgements
This work was funded by NERC grants NE/F009623/1 and NE/H021914/1A, a White Rose Consortium grant and beamtime at the Diamond light source under grants SM9197 and SM8989. We thank the Leverhulme Trust for financial support to the NEaar laboratory, University of York and Sheila Taylor (University of York) for provision of technical support for amino acid analyses.
References
- M.G. Canti and T.G. Piearce, “Morphology and dynamics of calcium carbonate granules produced by different earthworm species”, Pedobiol. 47, 511–521 (2003). doi: http://dx.doi.org/10.1078/0031-4056-00221
- L. Gago-Duport, M.J.I. Briones, J.B. Rodríguez and B. Covelo, “Amorphous calcium carbonate biomineralization in the earthworm’s calciferous gland: Pathways to the formation of crystalline phases”, J. Struct. Biol. 162, 422–435 (2008). doi: http://dx.doi.org/10.1016/j.jsb.2008.02.007
- L. Brinza, P.F. Schofield, M.E. Hodson, S. Weller, K. Ignatyev, K. Geraki, P.D. Quinn and J.F.W. Mosselmans, “Combining µXANES and µXRD mapping to analyse the heterogeneity in calcium carbonate granules excreted by the earthworm Lumbricus terrestris”, J. Synchrotron Rad. 21, 235–241 (2014). doi: http://dx.doi.org/10.1107/S160057751 303083X
- D.J. Tobler, J.D. Rodriguez-Blanco, K. Dideriksen, K.K. Sand, N. Bovet, L.G. Benning and S.L.S. Stipp, “The effect of aspartic acid and glycine on amorphous calcium carbonate (ACC) structure, stability and crystallization”, Proc. Earth Planet. Sci. 10, 143–148 (2014). doi: http://dx.doi.org/10.1016/j.proeps.2014.08.047
- M.E. Hodson, L.G. Benning, B. Demarchi, K. Penkman, J.D. Rodriguez-Blanco, P.F. Schofield and E.A.A. Versteegh, “Amorphous calcium carbonate stability in earthworm-secreted granules: an amino acid and synchrotron FTIR study”, Geochem. Trans. 16, 4 (2015). doi: http://dx.doi.org/10.1186/s12932-015-0019-z