Karsten Hinrichs and Andreas Furchner
Leibniz-Institut für Analytische Wissenschaften – ISAS – e.V., Department Berlin, Schwarzschildstr. 8, 12489 Berlin, Germany. E-mail: hinrichs@isas.de
Introduction
Driven by new developments in various branches of fundamental and materials research, such as optical and biosensing devices,1,2 functional polymer materials,3 meta-4 and biomaterials,5 the need for polarisation-dependent imaging and mapping characterisation techniques like ellipsometry6,7,8 is ever growing, always striving to push the boundaries of spatial and time resolution. In this respect, infrared spectroscopic ellipsometry is a strongly emerging field due to the recent progress in ellipsometric microscopy,9,10 near-field spectroscopy11,12 and the use of infrared lasers13,14,15 as brilliant radiation sources.
Similar to ellipsometry in the visible spectral range, IR ellipsometry provides information on film thickness and homogeneity. Moreover, the mid-infrared (MIR) spectral region from about 2.5 µm to 16.0 µm (4000–625 cm–1) is the fingerprint range of many molecular vibrations and phonons. By analysing contributions of different specific vibrational bands, IR ellipsometry provides access to valuable complementary information on composition, structural properties and interactions.7
When working with laboratory or synchrotron radiation sources, Fourier-transform infrared (FT-IR) spectrometers are typically used. For specific purposes, infrared grating spectrometers are also of interest. Depending on the probing wavelength and the used optics, possible lateral resolutions for far-field IR ellipsometry are restricted by the diffraction limit and are in the range of a few microns. The diffraction limit can, in principle, be overcome by near-field techniques. For both far-field and near-field techniques, tuneable infrared laser sources are becoming increasingly important as they open up new analytical possibilities regarding spatial and time resolution.
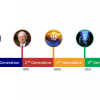
Increasing the lateral spatial resolution, as shown in Figure 1, from several millimetres (standard laboratory ellipsometer), to about 175 µm (ellipsometry using a laser or synchrotron radiation source), to about 40 µm (microscopic ellipsometry) has been an important goal for the method over the last decade.10 Nowadays, even polarisation-dependent infrared mapping at the nm scale has become available. Although first attempts in the direction of aperture-less scattering near-field ellipsometry11 have been performed, a general applicability to anisotropic materials or films has not yet been achievable by such approaches. Another alternative for polarisation-dependent near-field microscopy is the thermo IR-AFM14 (IR-atomic force microscopy) approach allowing one to measure the absorption-dependent extension of a sample.
Summarising here, spectroscopic far-field ellipsometry is the method of choice for contact-less and non-destructive microscopic characterisation of thin functional films and surfaces above the diffraction limit of a few µm, and also for characterisation of larger sample areas up to the mm2 and cm2 range. Optical simulation software packages for interpreting ellipsometric spectra of complex samples are commercially available from ellipsometer suppliers. Additional software solutions exist for numerical calculations in the time or frequency domains using Maxwell solvers, which is of particular relevance not only for understanding periodically structured surfaces like metamaterials, but also for arbitrarily structured materials.
Ellipsometric method
Upon reflection or transmission at a surface, linearly polarised radiation generally becomes elliptically polarised. For non-depolarising isotropic or uniaxial films for which no cross-polarised contributions (e.g., circular dichroism) are expected, the ellipsometric parameters tan Ψ and ∆ (relative amplitude ratio and phase difference, respectively) are the relevant measurement parameters.7,8 These are related to the complex reflection coefficients rp and rs, corresponding to the p-and s-polarised electric field components, respectively. Ψ and ∆ are complex functions of the incidence angle j0, the wavelength l, the optical constants of substrate (NS), ambient medium (N0) and layers (Nj), as well as of the layer thicknesses dj,
![]()
with N = n + ik (N: complex refractive index; n: refractive index; k: absorption index). The optical constants are related to the complex dielectric function e = e1 + ie2 via N = Öe. A fit of the parameters of an optical model to the measured values of tan Ψ and ∆ provides the layer thicknesses, the optical constants and the structural properties of layered samples.
The fundamental equations of ellipsometry are only valid for systems consisting of homogeneous phases with smooth and parallel interfaces. Nevertheless, surface roughness, graded or heterogeneous composition and anisotropy can be modelled in many cases. With generalised ellipsometry, all Müller matrix elements, connecting the incoming and outgoing Stokes vectors, can be determined,7,8 which is of particular interest, for example, for the analysis of ordered arrays of metamaterials.17
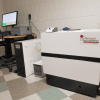
For the results presented here, custom-built mid-infrared ellipsometers (2.5–16.0 µm) were externally attached to a Fourier-transform interferometer (Bruker Optics, Ettlingen, Germany), either using a laboratory globar source or the synchrotron radiation source at the Berlin Electron Synchrotron Storage Ring BESSY II. Details about the measurements and the used IR ellipsometry set-ups are described in References 10 and 16.
A multiple angle rotating analyser IR mapping ellipsometer (SENTECH Instruments, Berlin, Germany) equipped with a HeNe laser (Multi IR Optoelectronics Co., Ltd) or a tuneable quantum cascade laser (QCL, Daylight solutions) was used for the presented laser ellipsometry measurements with time resolutions down to 80 ms.15 Optional CaF2 micro-focus lenses (acceptance angle = 2°) enabled measurements with a lateral resolution of 120 µm.

Figure 1. Mapping examples of thin films and typical lateral resolutions with standard laboratory ellipsometry (several mm2),10 synchrotron radiation ellipsometry (175 μm × 245 μm),10,16 microscopic ellipsometry (40 μm × 40 μm)10 and near-field IR microscopy (10 nm × 10 nm).12 For more details see Reference 9. Figure adapted with permission from Reference 9. Copyright 2013 American Chemical Society."
Sub-second laser mapping ellipsometry
Fast sample mapping in the infrared with sub-millimetre lateral resolution is achieved by using laser light sources.15 While the lateral resolution of about 120 µm is important for studying sample properties at a microscopic level, the high time resolution of up to 80 ms is critical for mapping larger sample areas in a reasonably short time. The choice of laser is dictated by the application and the material system under investigation. Various lasers, covering different spectral ranges, are commercially available and allow for measuring the optical sample properties of specific vibrational bands.
One application of laser mapping ellipsometry is the homogeneity study of thin polymer films, an example of which is shown in Figure 2.

Figure 2. Optical constants n and k of thin P3HT and PNIPAAm films on Si and Au, respectively, obtained from macroscopic ellipsometry (left), and corresponding thickness maps at the HeNe laser line of 2949 cm–1 with a lateral resolution of 120 μm × 250 μm (right). Figure adapted from Reference 15. Published by The Royal Society of Chemistry."
Polymers exhibit several spectral regions of characteristic molecular vibrations. Bands around 2950 cm–1 are usually related to stretching vibrations of CHx groups in the backbone and sidechains of the polymers. A HeNe laser emitting at 2949 cm–1 allows for mapping these bands with respect to film thickness, thereby providing insights into film homogeneity. Bands between 1800 cm–1 and 1000 cm–1 are related to various functional groups like thiophene, carbonyl or amide groups, and allow for the mapping of film homogeneity, anisotropy, chemistry, structural properties and interactions. This spectral region is accessible, for instance, with tuneable laser sources, such as quantum cascade lasers.
Figure 2 displays the macroscopic optical constants n and k of poly(3-hexylthiophene) [P3HT] and poly(N-isopropylacrylamide) [PNIPAAm] organic thin films. Corresponding ellipsometric thickness maps using a HeNe laser are shown on the right. Mapping of P3HT films and the identification of pinholes and shunts within these films is highly relevant for quality control of opto-electronic devices. Infrared mapping of a supposedly homogeneous P3HT test film reveals film-thickness variations between 50 nm and 80 nm. Even larger inhomogeneities are found towards the sample edges, correlating with artefacts from the spin-coating process. PNIPAAm, as a second example, is a widely used polymer for bioapplications and functional coatings. A homogeneous spin-coated PNIPAAm film was modified by pipetting three drops of water onto the water-soluble polymer surface. A map of the resulting model film shows a homogeneously covered area with a film thickness of d = (95 ± 3) nm as well as three strongly inhomogeneous polymer islands. While IR laser mapping ellipsometry can determine these film inhomogeneities, it can also reveal structural inhomogeneities via spectral mapping of vibrational bands. The P3HT and PNIPAAm thickness maps in Figure 2 were calculated from Y and D maps that cover 729 and 1939 individual spots, respectively. The maps were obtained in 25 min and 65 min, respectively, but this time can be dramatically decreased to 2 min and 6 min, respectively, if restricting the measurements to Y and cos D, which is sufficient for many applications. This also demonstrates that infrared laser ellipsometry is a valuable method for monolayer-sensitive time-resolved measurements, such as studies of adsorption, growth or other kinetic processes at a sub-second timescale.
High resolution infrared ellipsometry
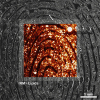
Brilliant synchrotron radiation sources can be used with FT-IR spectroscopic ellipsometry for thin-film sensitive measurements at lateral resolutions of at least 175 µm.10,16 The high brilliance of the synchrotron radiation eliminates the need of strong focusing, thus ensuring low opening angles, i.e., a better defined incidence angle. A detailed review on MIR synchrotron ellipsometry can be found in Reference 7. The correlation of ∆ and tan Ψ homogeneity maps allows one to discuss the separation of thickness as well as structural and chemical inhomogeneities. One example is the study of self-assembling monolayers on GaAs and Au, as indicated in Figure 1. Another example is the chemical-composition map of a 3 nm ultra-thin pH-responsive poly(acrylic acid) brush on Au,16 shown in Figure 3a. Parts of the brush were exposed to a pH 10 KOH solution, resulting in chemically distinct areas of protonated and dissociated carboxylic groups within the brush. Infrared mapping ellipsometry reveals these changes in film chemistry by measuring the corresponding characteristic COOH and COO– stretching vibrational bands.

Figure 3. a) pH-dependent chemical-composition map of a partially dissociated/protonated 3 nm polyelectrolyte brush on Au. b) Top: Measured p-polarised infrared microscopic reflection spectra (thick red lines, 4 × 4 map) of an anisotropic 1785 nm thick polyimide film on Si, compared with simulated spectra (black lines) for a thickness variation of 1760–1810 nm. Bottom: Thickness linescans with 327 μm step width. c) Measured (black) and calculated (orange) infrared microscopic ellipsometry tan Y spectra. Calculated spectra assume different tilt angles of the transition dipole moment of the 1516 cm–1 band. Data in a) from Reference 16. b) and c) adapted with permission from Reference 9. Copyright 2013 American Chemical Society.
For higher lateral resolutions than feasible with synchrotron radiation ellipsometry, a focusing optics is required. By using a Cassegrain objective, for example, it is possible with microscopic ellipsometry to achieve spatial resolutions of several 10 µm at thin-film sensitivity with standard laboratory sources.9,10 Infrared mapping microscopic ellipsometry is also sensitive to both film-thickness homogeneity and structural film properties. Figure 3b displays thickness maps of a uniaxially anisotropic 1785 nm thick polyimide film on silicon,9 again revealing a certain thickness gradient that is due to the spin-coating process. Furthermore, Figure 3c compares a measurement of the vibrational polyimide band at 1516 cm–1 with simulated spectra based on three different tilt angles of the corresponding transition dipole moment. The simulations show the sensitivity of IR microscopic ellipsometry towards variations in average molecular orientations within such polymer films, which is of high technological relevance, for instance, for liquid-crystal displays18 and photovoltaic applications.19
Note that, in principle, microscopic ellipsometry could resolve up to the diffraction limit when it would be combined with a synchrotron radiation source.
Conclusions
As discussed here, IR mapping ellipsometry is a powerful tool for the quantitative analysis of thin isotropic and anisotropic layers. The mid-infrared spectral range offers access to detailed structural and chemical information. This is of particular importance for characterisation of thin films of organic and inorganic materials, metamaterials and hybrid materials, and for the development of passivation and protection coatings as well as the design of new devices in optics and biotechnology. Using focusing optics and brilliant radiation like synchrotron or laser sources, lateral resolutions in the range of a few 10 µm to 100 µm with sub-second time resolutions per spot are possible for sensitive ellipsometric studies of thin functional films and surfaces. One important future direction for infrared mapping ellipsometry is its application as an in situ technique for non-invasive and simultaneous measurements of structural and chemical information at the solid–liquid interface.20
Acknowledgements
The authors like to thank K.-J. Eichhorn from IPF Dresden for cooperation in applying infrared ellipsometry for analysis of polymer films, J. Rappich from HZB in Berlin for cooperation in the field of thin functional films for optical and biosensor applications, Mrs I. Engler and Mr Ö. Savas¸ for technical assistance, and SENTECH Instruments GmbH (Berlin, Germany) for cooperation with the synchrotron ellipsometer at BESSY II and with the laser ellipsometer. Financial support of the European Union through the ProFIT program (contract no. 10153595), by the Senatsverwaltung für Wissenschaft, Forschung und Kultur des Landes Berlin and by the Bundesministerium für Bildung und Forschung is gratefully acknowledged.
References
- M. Li, S.K. Cushing and N. Wu, Analyst 140, 386 (2015). doi: http://dx.doi.org/10.1039/C4AN01079E
- A.P.F. Turner, Chem. Soc. Rev. 42, 3184 (2013). doi: http://dx.doi.org/10.1039/c3cs35528d
- M.A. Cohen Stuart, W.T.S. Huck, J. Genzer, M. Müller, C. Ober, M. Stamm, G.B. Sukhorukov, I. Szleifer, V.V. Tsukruk, M. Urban, F. Winnik, S. Zauscher, I. Luzinov and S. Minko, Nat. Mater. 9, 101 (2010). doi: http://dx.doi.org/10.1038/nmat2614
- Y. Lui and X. Zhang, Chem. Soc. Rev. 40, 2494 (2011). doi: http://dx.doi.org/10.1039/c0cs00184h
- R.P. Babu, K. O’Connor and R. Seeram, Prog. Biomater. 2 (2013).
- W. Ogieglo, H. Wormeester, K.-J. Eichhorn, M. Wessling and N.E. Benes, Prog. Polym. Sci. 42 (2015). doi: http://dx.doi.org/10.1016/j.progpolymsci.2014.09.004
- K. Hinrichs and K.-J. Eichhorn (Eds), Ellipsometry of Functional Organic Surfaces and Films. Springer, Berlin, Heidelberg (2014). doi: http://dx.doi.org/10.1007/978-3-642-40128-2
- M. Losurdo and K. Hingerl, Ellipsometry at the Nanoscale. Springer, Berlin, Heidelberg (2013). doi: http://dx.doi.org/10.1007/978-3-642-33956-1
- K. Hinrichs, A. Furchner, J. Rappich and T.W.H. Oates, J. Phys. Chem. C 117, 13557 (2013). doi: http://dx.doi.org/10.1021/jp401576r
- K. Hinrichs, A. Furchner, G. Sun, M. Gensch, J. Rappich and T.W.H. Oates, Thin Solid Films 571, 648 (2014). doi: http://dx.doi.org/10.1016/j.tsf.2014.02.006
- A. Govyadinov, I. Amenabar, F. Huth, P. Scott Carney and R. Hillenbrand, J. Phys. Chem. Lett. 4, 1526 (2013). doi: http://dx.doi.org/10.1021/jz400453r
- B. Pollard, E.A. Muller, K. Hinrichs and M.B. Raschke, Nat. Commun. 5, 3587 (2014). doi: http://dx.doi.org/10.1038/ncomms4587
- P. Bassan, M.J. Weida, J. Rowlette and P. Gardner, Analyst 139, 3856 (2014). doi: http://dx.doi.org/10.1039/C4AN00638K
- A. Dazzi, C.B. Prater, Q. Hu, D.B. Chase, J.F. Rabolt and C. Marcott, Appl. Spectrosc. 66, 1365 (2012). doi: http://dx.doi.org/10.1366/12-06804
- A. Furchner, G. Sun, H. Ketelsen, J. Rappich, K. Hinrichs, Analyst 140, 1791 (2015). doi: http://dx.doi.org/10.1039/C4AN01853B
- K. Roodenko, Y. Mikhaylova, L. Ionov, M. Gensch, M. Stamm, S. Minko, U. Schade, K.-J. Eichhorn, N. Esser and K. Hinrichs, Appl. Phys. Lett. 92, 103102 (2008). doi: http://dx.doi.org/10.1063/1.2892132
- T.W.H. Oates, T. Shaykhutdinov, T. Wagner, A. Furchner and K. Hinrichs, Adv. Mater. 26, 7197 (2014). doi: http://dx.doi.org/10.1002/adma.201402012
- N.A.J.M. van Aerle and A.J.W. Tol, Macromolecules 27, 6520 (1994). doi: http://dx.doi.org/10.1021/ma00100a042
- K. Hinrichs, M. Levichkova, D. Wynands, K. Walzer, K.-J. Eichhorn, P. Bäuerle, K. Leo, M. Riede, Thin Solid Films 525, 97 (2012). doi: http://dx.doi.org/10.1016/j.tsf.2012.10.069
- F. Zaera, Chem. Rev. 112, 2920 (2012). doi: http://dx.doi.org/10.1021/cr2002068