Gerald Steiner,a Thomas Bartels,b Allison Stelling,a Anke Burkhardt,a Maria-Elisabeth Krautwald-Junghannsb and Edmund Kocha
a Dresden University of Technology, Faculty of Medicine Carl Gustav Carus, Clinical Sensoring and Monitoring, Fetscherstr. 13, 01307 Dresden, Germany. E-mail: gerald.steiner@tu-dresden.de
bUniversity of Leipzig, Faculty of Veterinary Medicine, Clinic for Birds and Reptiles, An den Tierkliniken 17, 04103 Leipzig, Germany
Introduction
Usually, it is not difficult to distinguish between female and male birds of the same species. Differences in size and colour of the plumage are clear external sexual characteristics. However, numerous bird species, nestlings and immature birds, in particular, lack these visible characteristics. Knowledge of a bird’s gender is important in many fields. In particular, poultry breeders, veterinary practitioners, ornithologists and aviculturists are often highly interested to know the gender of a bird.1 For example, the determination of a bird’s gender is essential for proper pairing of birds, and knowing the gender of a bird allows veterinarians to diagnose gender-specific diseases. Furthermore, the poultry industry is also interested in fast, objective and inexpensive methods for determining the sex of chickens or turkeys as early as possible.2
In addition to the gender determination of young birds, it is also of interest to determine the gender of an avian egg. This is a more difficult challenge than the sexing of birds, because in addition to determination of an “egg’s gender” the egg must be intact so that the embryo may develop.
The gold standard for determination of the gender of monomorphic or immature birds is polymerase chain reaction (PCR). In contrast to mammals, in birds males are homogametic with two Z sex chromosomes, whereas females are heterogametic with one Z and one W sex chromosome.3 The W chromosome is much smaller than the Z chromosome.4 Therefore, male birds always have a significantly larger amount of DNA than female birds. Although the avian DNA gender determination is highly precise, this method is quite expensive and takes a minimum of a few days. More recently, novel approaches based on UV-resonance Raman5 and mid-infrared6 spectroscopy have been developed to determine the gender of chicken and six-week-old turkey and chicken poults, respectively.
Infrared spectroscopic feather sexing
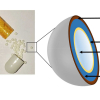
Spectroscopic gender determination is based on the fact that each growing feather has a high amount of dividing germinal cells which contain the genetic information about the gender.7 Figure 1 shows schematically the composition of a feather. The feather pulp contains a large number of germinal cells.

These pulp cells can be easily extracted by exerting a slight pressure. A small amount of pulp cell suspension from only one feather is sufficient for the spectral gender determination. The drop of the cell suspension can be placed on an infrared transparent window or onto an attenuated total reflection (ATR) crystal. Figure 2 shows the standard deviation of spectra taken from feather pulps of 23 male turkey poults and those from 23 female turkey poults.

At a first glance, the spectra appear very similar and exhibit relatively small differences, despite the fact that the samples are from different poults. The most prominent bands are the amide I and amide II absorptions. Absorptions from phosphate groups of nucleic acids occur mainly in the spectral range from 1000 cm–1 to 1250 cm–1.8 A closer inspection of this range reveals differences in the intensity of the bands located at 1048 cm–1, 1084 cm–1 and 1122 cm–1 between the spectra of male and females. Figure 3 shows the average spectra for female and male germinal cells. The spectra are normalised to the absorbance at 1084 cm–1.

The 1084 cm–1 band arises from PO2– symmetric stretching vibrations and is often assigned to DNA.9 However, it must be noted that several other spectral contributions from phospholipids, free phosphate, esters and carbohydrates and proteins contribute to the band contour. The average spectrum of male germinal cells shows a significantly stronger absorption at 1122 cm–1 than the spectrum of the female cells. This band is usually assigned to RNA ribose C–O stretching. For example, the ratio of the band intensities at 1122 cm–1 and 1020 cm–1 has been often used to calculate the RNA/DNA ratio as a marker for tumour cells. A higher RNA content reveals an enhanced germinal cell proliferation. Indeed, male turkey poults grow significantly faster and will be stronger than females. Consequently, the RNA content is increased. Obviously, the high RNA content outweighs the differences in the DNA content. These significant spectral differences within the average spectra should be enough to allow discrimination between male and female birds on the basis their infrared spectra. Multivariate classification methods are a common approach to extract the wanted spectral information. Principal component analysis (PCA) is one of the first choices to identify spectral markers. The PCA score plot of the third and first principal component (PC) is shown in Figure 4.

As it can be seen in the plot, germinal cells from female and male turkey poults are clearly divided into two clusters. Two spectra are misclassified. A closer inspection revealed that these two spectra are from one sample. A possible reason for this misclassification is that sex diagnosis in fattening turkeys is usually performed by examining a day-old chick’s vent for the presence, or absence of, the formation of a male sexual organ. The international standard for the vent sexing of day-old gallinaceous chicks is 98% accuracy.10
Sexing of eggs?
Now we would like discuss whether it is also possible to determine the gender of blastoderm cells in an avian egg. Determining the sex would allow the selection of either male or female eggs for incubation. For hundreds of years, people have speculated about a relationship between a chicken egg’s size and the gender. However, up to now there is no method available that can be used to identify the gender of an unincubated egg without destroying the egg. Can infrared spectroscopy provide a new approach to make this old dream a reality? Let us have a look at a normal fertilised, but unincubated, chicken egg. The photograph in Figure 5 shows a cracked-open egg. On the top of the yolk is a small disc of slightly different colour.

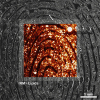
The so-called called germinal disk has 40,000 to 60,000 blastoderm cells that contain information on the embryo’s gender.11 The germinal disc is covered by several membranes and a protein layer a few micrometres thick. When taking a small amount of blastoderm cells, all these materials will be in the sample and prevent the identification of the gender. To overcome this limitation infrared spectroscopic imaging has be used. Figure 6 shows the microscopic image of the sample. In this unstained image, blastoderm cells are not visible. The grid indicates the area of the infrared spectroscopic imaging. An infrared imaging map of 2 × 2 images encompasses 16,384 individual infrared spectra. The mathematical investigation of spectral variations was performed by PCA of the spectral range from 1000 cm–1 to 1150 cm–1. This range represents mainly absorption bands from phosphates, carbohydrates and phospholipids. Principal components of the spectroscopic imaging data cube are formed by loading plots and score maps. The loading plots correspond to a spectrum where the variation is highest and weight the signals in the positive and negative direction. The score map reveals the weight of the loading plot for each pixel of the image. Loading vectors and score maps of the first, second and third PCs are represented in Figure 7. The first PC describes the average spectrum. The loading plot of PC 2 exhibits absorption bands of phosphates. Therefore, we assign the second PC to blastoderm cells. The third PC shows mainly absorption bands from protein and lipids.


The fact that in the second PC information about the blastoderm cells are present demonstrates that infrared spectroscopy has also the potential to determine the gender of an unincubated egg.
Summary
The use of infrared spectroscopy to determine the gender of young birds shows that it is a fast and accurate method with the potential to be used by the breeding industry and many other fields. Second, results of a pilot study show that infrared spectroscopy also provides an approach to determine the gender of fertilised unincubated eggs. The difference in the RNA content, as well as the amount of DNA between the Z and W sex chromosomes, are very sensitive markers for spectroscopy-based sexing. In the future, these is a strong possibility that infrared spectroscopy can be used for an in ovo gender determination which could save millions of unwanted male layer chicks from being killed shortly after hatching.
Acknowledgements
This work was financially supported by the German Federal Ministry of Food, Agriculture, and Consumer Protection (BMELV) through the Federal Office for Agriculture and Food (BLE), grant number 511-06.01-28-1-33.010-07, and the Ministry of Environment, Energy, Agriculture and Consumer Protection of Hessen. The authors gratefully acknowledge the Lohmann Tierzucht GmbH (Cuxhaven, Germany) for their financial support. Also, special thanks to the team of Professor H. Fuhrmann (Institute of Physiological Chemistry, Faculty of Veterinary Medicine, University of Leipzig) for technical assistance and to Bruker Optik GmbH (Leipzig, Germany) for their technical support.
References
- B.W. Ritchie, G.J. Harrison and L.R. Harrison, Avian Medicine: Principles and Application. Wingers Publishing, Lake Worth, FL, USA (1994).
- R. Preisinger, World. Poult. Sci. J. 59, 52–56 (2003).
- R.D. Crawford (Ed.), Poultry Breeding and Genetics. Elsevier, Amsterdam, Netherlands (1990).
- T.R. Tiersch, World. Poult Sci. J. 64, 24–30 (2003).
- M. Harz, M. Krause, T. Bartels, K. Cramer, P. Rösch and J. Popp, Anal. Chem. 80, 1080–1086 (2008).https://doi.org/10.1021/ac702043q
- G. Steiner, T. Bartels, M.-E. Krautwald-Junghanns, A. Boos and E. Koch, Anal. Bioanal. Chem. 396, 465–470 (2010).https://doi.org/10.1007/s00216-009-3273-z
- A.S. King and J. McLelland (Eds), Form and Function in Birds, Vol. 3. Academic Press, London, UK (1985).
- G. Socrates, Infrared and Raman Characteristic Group Frequencies. John Wiley & Sons, Chichester, UK (2001).
- H. Fabian, M. Jackson, L. Murphy, P.H. Watson, I. Fichtner and H.H. Mantsch, Biospectr. 1, 37–45 (1995).https://doi.org/10.1002/bspy.350010106
- P. Phelps, A. Bhutada, S. Bryan, A. Chalker, B. Ferrell, S. Neuman, C. Ricks, H. Tran and T. Butt, World. Poult. Sci. J. 59, 32–37 (2003).
- F. Ellendorff and S. Klein, World. Poult. Sci. J. 59, 5–6 (2003).https://doi.org/10.1079/WPS20030002


