Richard D. Pilkington,a J. Stuart Astina and John S. Cowpeb
aJoule Physics Laboratory, Materials & Physics Research Centre, University of Salford, Salford, M5 4WT, UK.
E-mail: R.D.Pilkington@salford.ac.uk
bIsotope Geochemistry & Cosmochemistry Group, University of Manchester, Manchester, M13 9PL, UK
Introduction
Laser-induced breakdown spectroscopy (LIBS) is a powerful optical emission spectroscopy (OES) analytical tool capable of sampling solids, liquids and gases for research and industrial applications. A pulsed laser is employed to vaporise and excite an analyte forming a transient plasma or plume which subsequently expands away from the sample surface. The optical emission from the relaxation of excited species within the plasma yields information regarding various properties of the material under test. LIBS historically has been a qualitative technique, but over recent years it has developed into a quantitative materials micro-analysis technique, capable of determining the elemental composition of solids, liquids and gases as well as ascertaining various material properties.
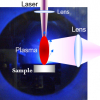
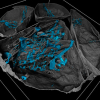
The basis of the LIBS technique requires the formation of a short-lived, transient plasma from the sample under test. High-intensity, pulsed laser radiation is focused onto the sample and if the laser fluence exceeds a material-specific threshold value, typically 109–1014 W m2, the sample is ablated forming a plume propagating away from the sample surface (see Figure 1).

Figure 1. Non-dispersed image of expanding laser plume.
The ablated material is composed of neutral particles, free electrons and ionic species, and expands as a high-temperature plasma, approximately 103–105 K. Spectroscopic analysis of the optical emission from the excited plasma species enables identification of the material being analysed. Typically the optical emission from the expanding plasma is dispersed and subsequently captured and analysed (see Figure 2).

Figure 2. Laser-induced breakdown spectroscopy general set-up.
The captured emission spectrum provides information regarding the elemental composition of the sample, the temperature and particle density of the plasma, and the degree of plasma fractionalisation. Suitably delayed gated capture of the spectra enables temporal investigation of plasma characteristics and expansion dynamics. The versatility of LIBS has seen it employed in numerous industrial, environmental, life science and archaeological applications, to give but a few examples. Over the past decade a small number of publications have highlighted the possibility of using LIBS for the measurement of certain physical properties of solids such as the hardness. This article will concentrate on how LIBS may be used to obtain in situ hardness measurements.
General applications of LIBS
Since the first publication in 1962,1 LIBS has become established as an extremely versatile analytical tool. Year on year more research is being reported in this expanding field (see Figure 3).

Figure 3. LIBS publications per year from “Web of Science”.>
Whilst there is still research into developing the technology associated with the use of LIBS for qualitative and quantitative analysis, the technique is becoming established in a number of diverse areas. These include trace elemental mapping,2 forensics,3 chemometric methods for sample classification,4 archaeological anthropology,5 smart surgical instrumentation,6 cancer detection,7 discrimination of bacterial strains8 and hardness studies etc.
The analysis of hardness using LIBS
The definition of a material’s hardness is related to its resistance to deformation, abrasion, indentation etc. It is difficult to quantify, and measurements are made relative to other quantifiable parameters such as tensile strength, modulus of elasticity and frictional coefficients etc. Hardness measurements do not give a direct indication of a material’s functional properties, but they do correlate directly with a material’s strength and wear resistance.
A common standard hardness measuring tool uses the Vickers hardness test which relates the optical measurement of an indented area to an applied load; the hardness is measured using the Vickers hardness number (VHN). The standard instrumentation imposes specific sample requirements, including surface finish and sample dimensions and therefore cannot normally be used as an in situ technique. LIBS offers the potential for in situ hardness measurements, without prior sample preparation.
In 2006 Tsuyuki et al.9 published the first paper that established a link between the intensity ratio of calcium emission lines and concrete strength and thus deduced that a material hardness may be inferred by the analysis of laser-induced plasmas. This work was followed by an investigation into different calcified tissue materials carried out by Abdel-Salam et al.10 who showed that the values of the atomic line intensity ratios of CaII : CaI and MgII : MgI could be correlated with the tissue hardness. They originally related this correlation to the repulsive force of the laser-induced shockwaves and this was confirmed and proved experimentally. Abdel-Salam et al. also found that there is a correlation between the ionic to atomic spectral lines emission ratios and the surface hardness of solid steel targets. LIBS was used to measure the ionic to atomic spectral lines intensity ratio of Zirconium (I ionic : I atomic) in specially prepared steel alloys that had previously been thermally treated to obtain different surface hardnesses.11
LIBS research carried out within the photonics group at Salford University has investigated the relationship between surface hardness measurements of three apatite-based bio-ceramics with ionic and neutral emission ratio, plasma excitation temperature and plasma ionisation equilibrium temperature.
The emission spectra from a plasma plume were collected using an optical fibre coupled to the entrance slit of an Acton Research Spectra Pro 500i 0.5-m imaging spectrometer. The output of the spectrometer was coupled to a Princeton Instruments PI-MAX ICCD (intensified charge-coupled device) camera that utilised a proximity focused MCP (micro-channel plate) intensifier and a 1024 × 256-pixel thermoelectrically cooled CCD array. The integration time for each acquisition was fixed at 500 ns and the capture delay time was fixed at 4 µs after laser firing. Twenty-five individual LIBS measurements were performed on each of the samples under identical experimental conditions.
It is well known that certain emission lines are prone to self-absorption, and in extreme cases reversal, under the conditions encountered in typical LIBS plasmas; this may corrupt plasma diagnostic measurements. In order to minimise the effects of self-absorption it is desirable to study emission lines arising from a minor component of the analyte and preferable to select emission lines that do not correspond to resonant transitions.
The neutral Mg(I) 278.30 nm and the ionic Mg(II) 279.55 nm emission lines were considered in our study of the hardness determination of bio-ceramic materials. Results indicate that changes in the values of the emission line ratio can be interpreted as a difference in the hardness of the target material (see Figure 4).

Figure 4. Ratio of ionic Mg(II) and neutral Mg(I) emission line intensity vs VHN.
The Saha–Eggert equation relates the ratio of the two emission lines to the plasma ionisation temperature (assuming local thermodynamic equilibrium, LTE):

where all terms have their usual meanings.
Hence, it is possible to relate the hardness value to the plasma ionisation temperature (see, for example, Figure 5).

Figure 5. Ionisation temperature vs VHN.
Although it is a requirement of the theory that the plasma is in LTE to interpret the ionisation temperature from the ratio of the two emission lines, in a laser-induced transient plasma this condition may not be present. Changes in the values of the ionisation temperature can still be interpreted as a difference in the hardness of the target material.
The line-to-continuum ratio method was used to determine the plasma excitation temperature, Te, and this also resulted in a linear relationship with the Vickers hardness number of the bio-ceramic material.12
Other published work demonstrates the versatility of LIBS. Vítková et al.13 used the technique to study the hardness of bricks related to the firing temperature, while Jun Li et al. investigated the aging characteristics (including hardness) of T91 steel.14
In conclusion, laser-induced breakdown spectroscopy should not be considered as only a spectrochemical analytical technique but should be recognised as a flexible tool capable of on-line feedback in manufacturing processes, surgical interventions and the measurement of surface hardness.
References
- F. Brech and L. Cross, Appl. Spectrosc. 16, 59 (1962).
- V.K. Unnikrishnan, R. Nayak and S. Bhat, Conference on Optical Diagnostics and Sensing XV-Toward Point-of-Care Diagnostics, San Francisco, CA (2015).
- F.J. Fortes, M.D. Perez-Carceles and A. Sibon, “Spatial distribution analysis of strontium in human teeth by laser-induced breakdown spectroscopy: application to diagnosis of seawater drowning”, Int J. Legal Med. 129, 807–813 (2015). doi: http://dx.doi.org/10.1007/s00414-014-1131-9
- S. Moncayo, S. Manzoor, F. Navarro-Villoslada and J.O. Caceres, “Evaluation of supervised chemometric methods for sample classification by laser induced breakdown spectroscopy”, Chemometr. Intell. Lab. Syst. 146, 354–364 (2015). doi: http://dx.doi.org/10.1016/j.chemolab.2015.06.004
- G.D. Al-Khafif and R. El-Banna, “Reconstructing ancient Egyptian diet through bone elemental analysis using LIBS (Qubbet el Hawa Cemetery)”, Biomed. Res. Int. Article ID 281056 (2015). doi: http://dx.doi.org/10.1155/2015/281056
- R. Kanawade, F. Mahari and F. Klaempfl, “Qualitative tissue differentiation by analysing the intensity ratios of atomic emission lines using laser induced breakdown spectroscopy (LIBS): prospects for a feedback mechanism for surgical laser systems”, J. Biophoton. 8, 153–161 (2015). doi: http://dx.doi.org/10.1002/jbio.201300159
- Y. Markushin, P. Sivakumar and D. Connolly, “Tag-femtosecond laser-induced breakdown spectroscopy for the sensitive detection of cancer antigen 125 in blood plasma”, Anal. Bioanal. Chem. 407, 1849–1855 (2015). doi: http://dx.doi.org/10.1007/s00216-014-8433-0
- S. Manzoor, S. Moncayo and F. Navarro-Villoslada, “Rapid identification and discrimination of bacterial strains by laser induced breakdown spectroscopy and neural networks”, Talanta 121, 65–70 (2014). doi: http://dx.doi.org/10.1016/j.talanta.2013.12.057
- K. Tsuyuki, S. Miura, N. Idris, K. Hendrik, T. Jie and K. Kagawa, “Measurement of concrete strength using the emission intensity ratio between Ca(II) 396.8 nm and Ca(I) 422.6 nm in a Nd:YAG laser-induced plasma”, Appl. Spectrosc. 60, 61–64 (2006). doi: http://dx.doi.org/10.1366/000370206775382668
- Z.A. Abdel-Salam, A.H. Galmed, E. Tognoni and M.A. Harith, “Estimation of calcified tissues hardness via calcium and magnesium ionic to atomic line intensity ratio in laser induced breakdown spectra”, Spectrochim. Acta B 62, 1343–1347 (2007). doi: http://dx.doi.org/10.1016/j.sab.2007.10.033
- Z. Abdel-Salam, Z. Nanjing, D. Anglos and M. Harith, “Effect of experimental conditions on surface hardness measurements of calcified tissues via LIBS”, Appl. Phys. B 94, 141–147 (2009). doi: http://dx.doi.org/10.1007/s00340-008-3304-z
- J.S. Cowpe, R.D. Moorehead, D. Moser, J.S. Astin, S. Karthikeyan, S.H. Kilcoyne, G. Crofts and R.D. Pilkington, “Hardness determination of bio-ceramics using laser-induced breakdown spectroscopy”, Spectrochim. Acta B 66, 290–294 (2011). doi: http://dx.doi.org/10.1016/j.sab.2011.03.007
- G. Vítková, L. Prokeš, K. Novotný, P. Porˇízka, J. Novotný, D. Všianský, L. Cˇelko and J. Kaiser, “Hardness determination of bio-ceramics using laser-induced breakdown spectroscopy”, Spectrochim. Acta B 101, 191–199 (2014). doi: http://dx.doi.org/10.1016/j.sab.2014.08.036
- J. Li, J. Lu, Y. Dai, M. Dong, W. Zhong and S. Yao, “Correlation between aging grade of T91 steel and spectral characteristics of the laser-induced plasma”, Appl. Surf. Sci. 346, 302–310 (2015). doi: http://dx.doi.org/10.1016/j.apsusc.2015.03.186